Analyzing Surveys with Remark Classic OMR
Remark Classic OMR includes a full-featured, easy-to-use, and very powerful analysis functionality providing detailed analysis on surveys, ballots and other forms.
Remark Classic OMR includes a full-featured, easy-to-use, and very powerful analysis functionality providing detailed analysis on surveys, ballots and other forms.
Remark Classic OMR includes Remark Quick Stats®, a built-in analysis and reporting package that is used to analyze survey-style forms. With the click of a button, the software provides many standard reports. Analyzing surveys has never been so easy.
The reports produced in Remark Quick Stats range from several types of item analysis to descriptive statistics to responses to open-ended questions. Please use the list of reports below to see how the reports included in Remark Quick Stats can help you with analyzing surveys.
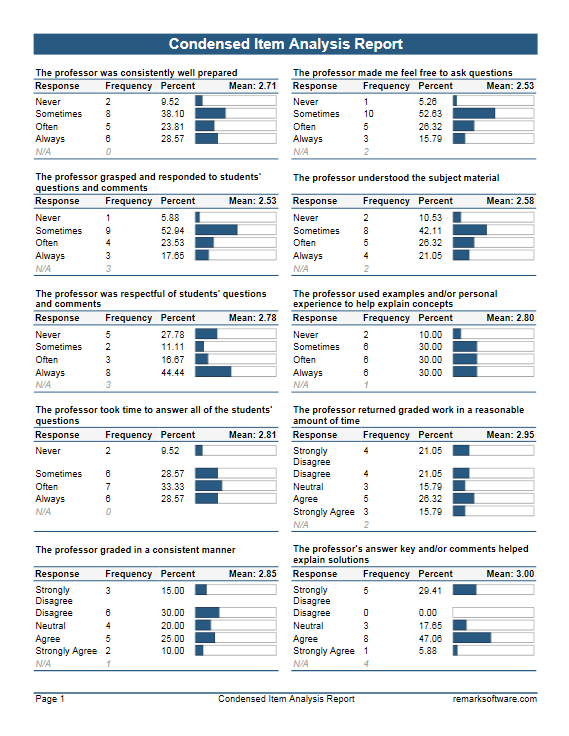
Item Analysis Reports show detailed information on each of the items on your survey form. Reports include:
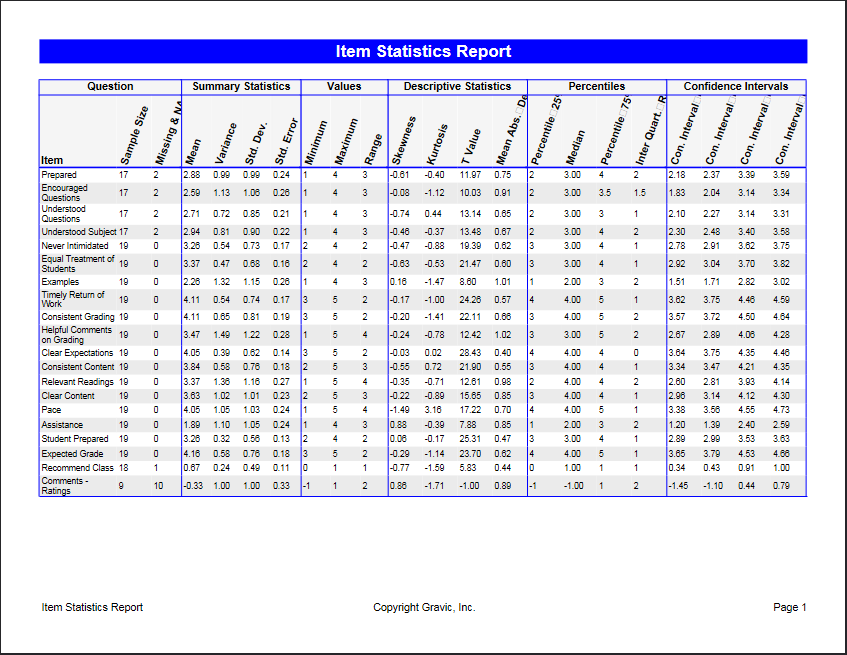
Item Statistics Reports show detailed statistics about the items. You can also break down the survey by demographic data.
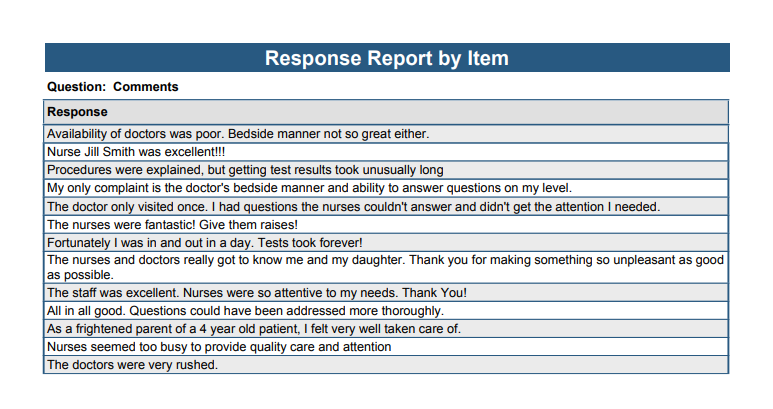
Response reports allow you to view all of the responses made by a respondent or all responses for a specific question. This is particularly useful when looking at open-ended questions such as comments.