Adam Larsen is the assistant superintendent of an Illinois school district. He and the rest of the staff are dedicated to helping their students do well on the College Board Organization’s Scholastic Aptitude Test (SAT®). During a School Improvement Day, high school students took an official College Board released practice test, while simulating actual testing conditions. The staff used Remark Office OMR to analyze the best way to prep their students for the real exam.
The SATs can be very stressful for students and educators alike. In order to ensure that his students do well, Mr. Larsen wanted to know how best to teach them the essential information for the test, but it was unclear what exactly his students did and did not know.
The staff first created its own bubble sheet for the practice test using Microsoft Word, and graded the responses with Remark Office OMR. Within a day or two, teachers could distribute an authentic looking score report, created in Microsoft Word, as well as students’ graded responses and answer explanations.

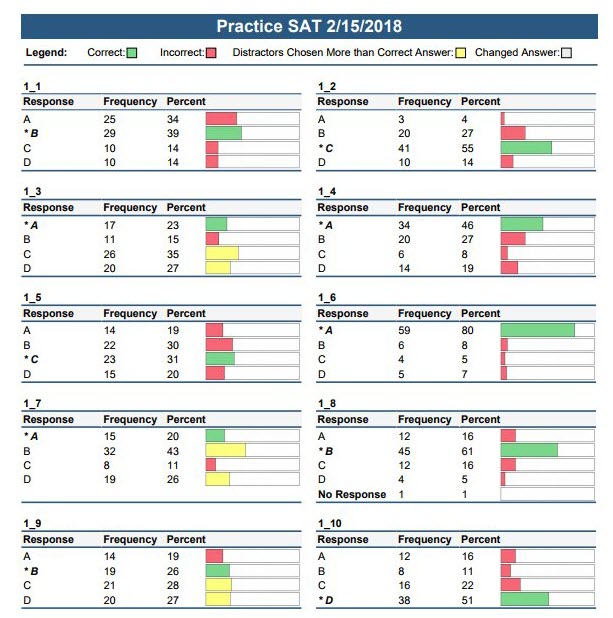
The teachers then used different report functions from the Remark software to obtain a thorough understanding of what questions were missed and why. For example, they ran a report that found the most frequently missed and correctly answered questions, along with an analysis of the reliability using point-biserials and p-values. They also found common misconceptions in word definitions and formulas with frequency distributions of response patterns for each question. The questions in which distractors were chosen more often than the correct answers contained the misconceptions.
The teachers then combined the statistical data about student responses with the test questions to eliminate the need to go back and forth from the test document to the reports.
Finally, all of the raw score data was exported to Microsoft Excel and weighted accordingly to find each student’s “SAT Score”. Teachers could then use the spreadsheet to see each student’s overall score as well as sub scores in math, reading, and writing. In addition, sub topics like “Words in Context” and “Problem Solving and Data Analysis” were also analyzed and reported.
With all of their newly collected data, teachers at the school are forming different specialized groups for students to help with the progression of newly identified areas of improvement. Mr. Larsen himself noted that the outcome of this experience was, “a closely-simulated test experience, timely corrective feedback, focused discussions about student performance, and deliberative practice”.