Support often receives calls asking if it’s possible to filter data by specific criteria contained within a data set. Filtering is completed within Remark Quick Stats. You can filter both grade and survey data. There are two ways you can filter.
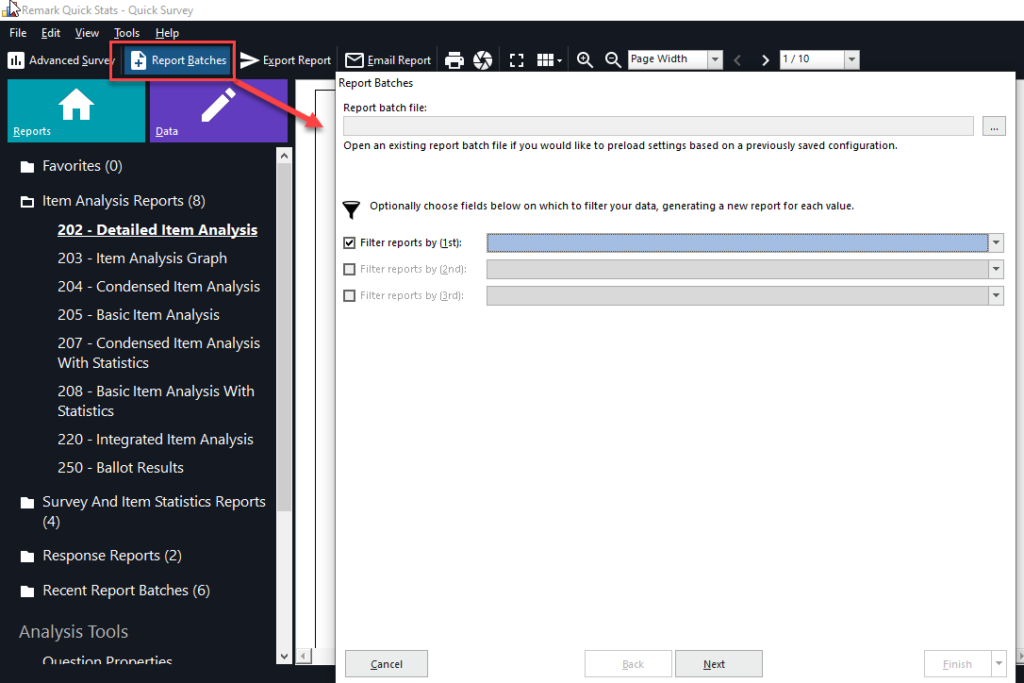
The first way is by using Report Batches. When using Report Batches, you are stepped through the process of selecting up to three regions to use as your filter criteria. You can then run, print and save multiple reports at a time based on the filter criteria selected. Exports include PDF, HTML, TIF, Text and RTF reports. Once a report batch is created, it can be saved for reuse. Report batch files can also be linked so you can run one after another if reports are needed on different filter criteria. If you need to frequently generate the same reports on data collected in a specific OMR template, Report Batches can be a definite time-saver!
To work with Report Batches, click on Quick Grade, Advance Grade, Quick Survey or Advance Survey to open Remark Quick Stats, then select the Report Batch option from the tool bar or select Report Batches from the Task Pane.
The second way you can filter within Remark Quick Stats is by using the Filter window. Here you can manually specify as many filter parameters as desired in order to parse your data as needed. Once a filter is created, you can click on Reports and reports will generate based on that specific filter. These filters can also be saved for later use.
To work with Filters, click on Quick Grade, Advance Grade, Quick Survey or Advance Survey to open Remark Quick Stats, then click the Data tile. This will bring you to the Primary data set. Click on Filter to begin creating a filter. Enter a filename then enter at least one your Field, Operator and Value. The area at the bottom of the filter window will display if there are any items that meet your filter criteria. Save the filter, if desired.
You can switch back and forth between the filter(s) and the Primary data set by changing the filter displayed to the right of the Filter button. Once a filter is created and selected, click the Reports tile to generate reports specific to the chosen filter. The reports will display the applied filter in the upper left of the report. If you need to run reports on the primary data set, don’t forget to switch the filter back to Primary.
It’s important to remember that if you will need to filter data by specific criteria, that criteria must be included in your data. While there are some circumstances where data not collected by your form can be added if not on the form such as using prompt for fill value field which will add identical information to each row of data, it is best to design your forms so the necessary data is captured directly from your completed forms.
Remark Support can be reached Monday – Friday (except major holidays) from 9AM – 6PM Eastern Time at 610-647-8595 or by email at [email protected].
Share This
What Now?