Remark Test Grading’s Reports
Remark Test Grading includes full-featured, easy-to-use, and powerful grading functionality providing educators a clear view into student, class, test, and item performance on the test.
Remark Test Grading includes full-featured, easy-to-use, and powerful grading functionality providing educators a clear view into student, class, test, and item performance on the test.
With Remark Test Grading’s reports, you can quickly see what your students understand, and more importantly, what they don’t!
The reports produced in Remark Test Grading range from class summaries showing detailed student and question achievement, to item analysis that breaks down question performance, and individualized student grade reports. Below are examples of the reports included in Remark Test Grading.
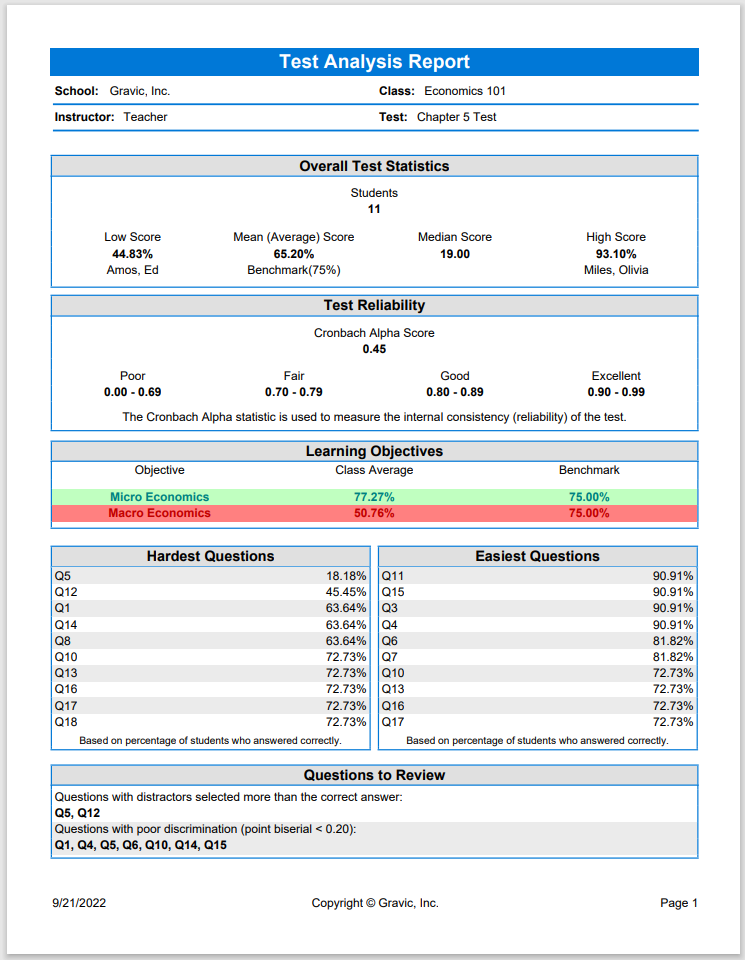
The Test Analysis Report provides overall summary information and points out red flags in a test, such as questions where a distractor is chosen more than the correct answer, students showing very strong comparisons of correct/incorrect answers, and test questions with a poor correlation.
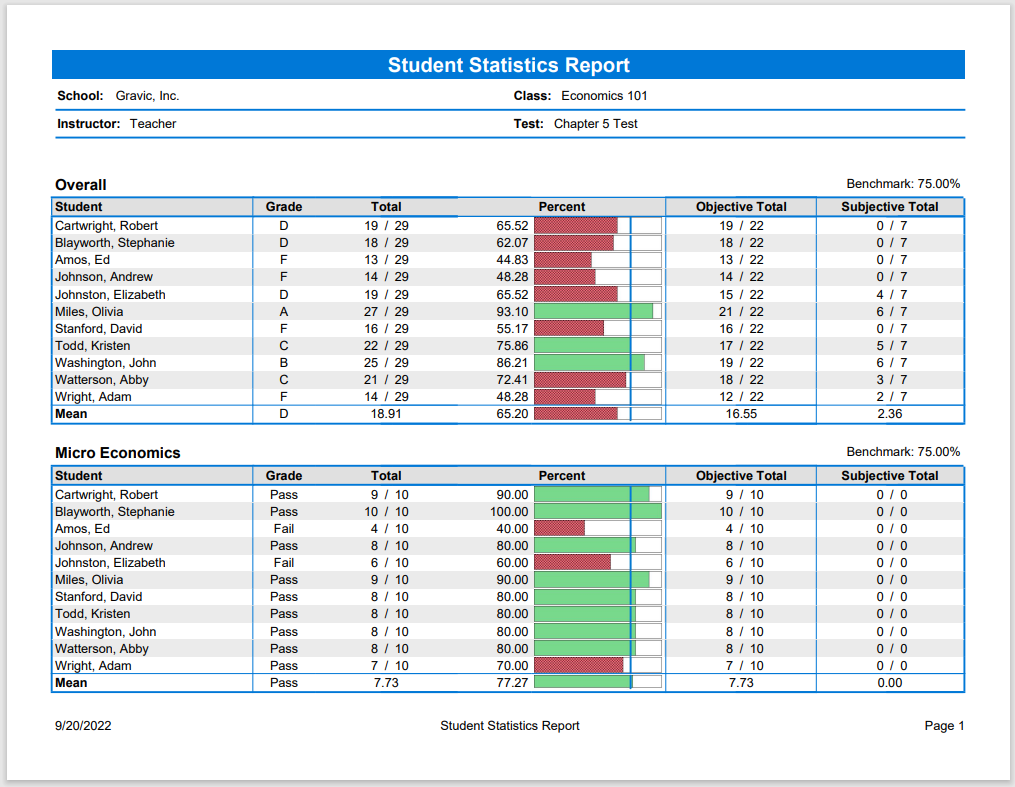
The Student Statistics Report is used to view performance each of the students in the class on the test. Optionally shows how they scored on learning objectives, objective questions, and subjective questions. Great report for quickly seeing how students are performing and whether they are meeting standards.
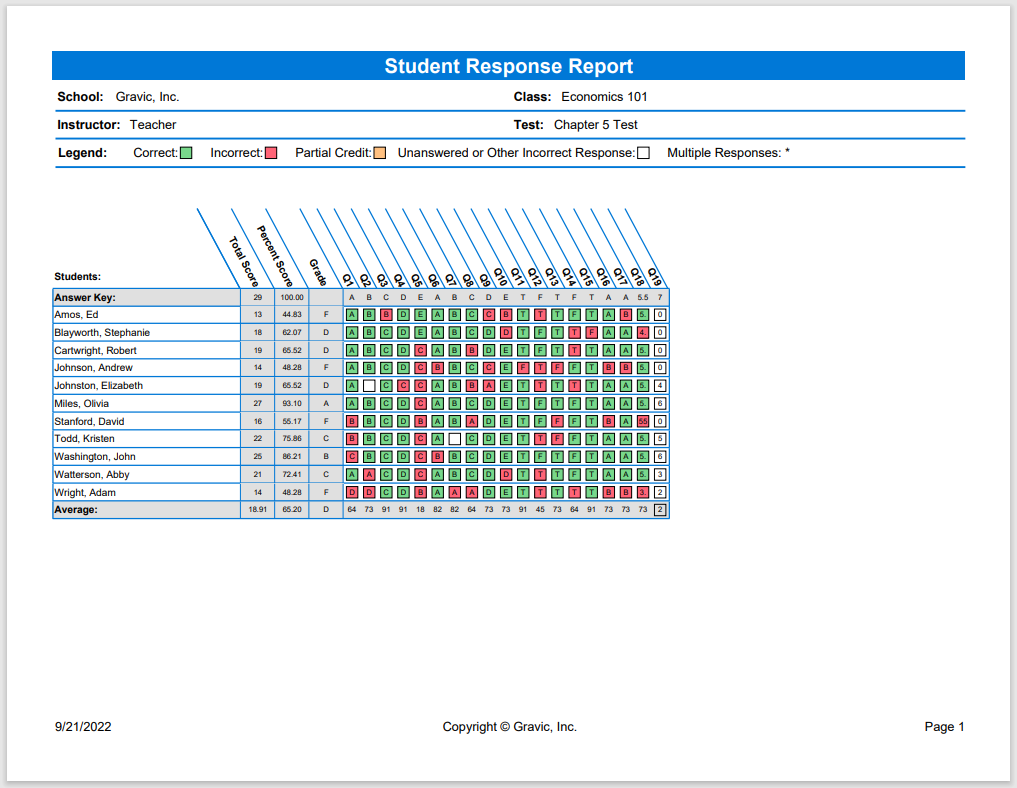
The Student Response Report provides a matrix view of each student’s answers to the questions on the test. Answers chosen are displayed and colored based upon correct/incorrect. This report allows you to quickly see performance on both a student and question level.
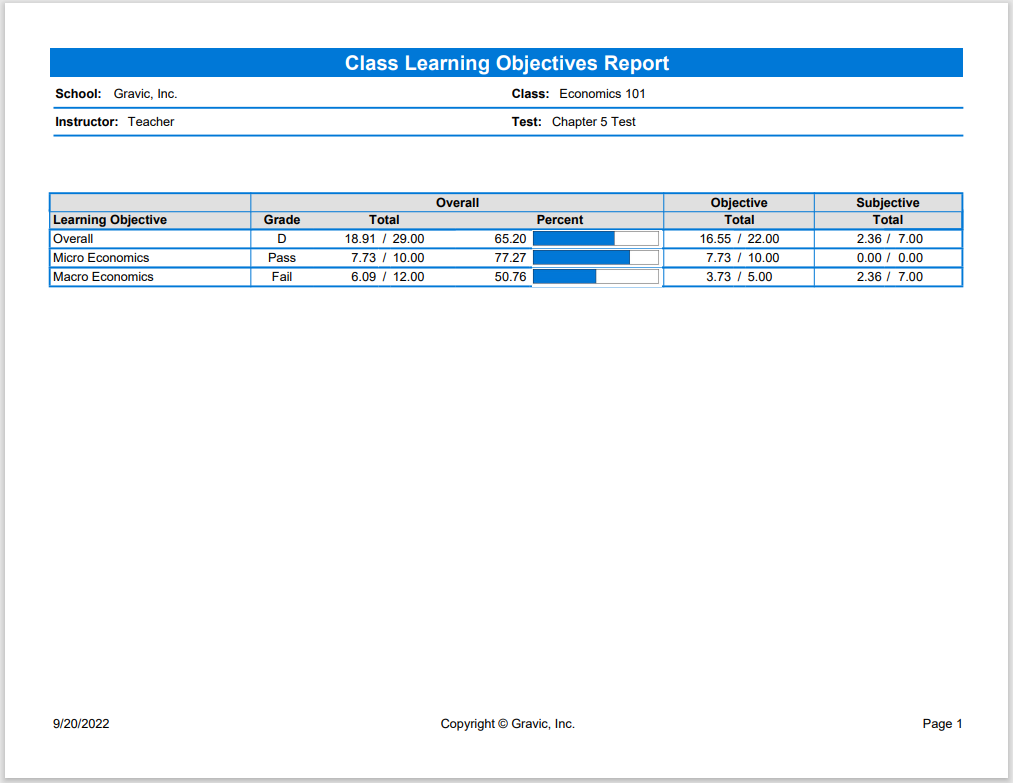
The Class Learning Objectives Report displays the class average percent and grade for each learning objective and for the entire test. It also displays the average number of objective and subjective points awarded within each learning objective. Learning objectives can be sorted by name or by the total number of points possible. Additionally, the number of questions that were answered correctly or incorrectly can be displayed.
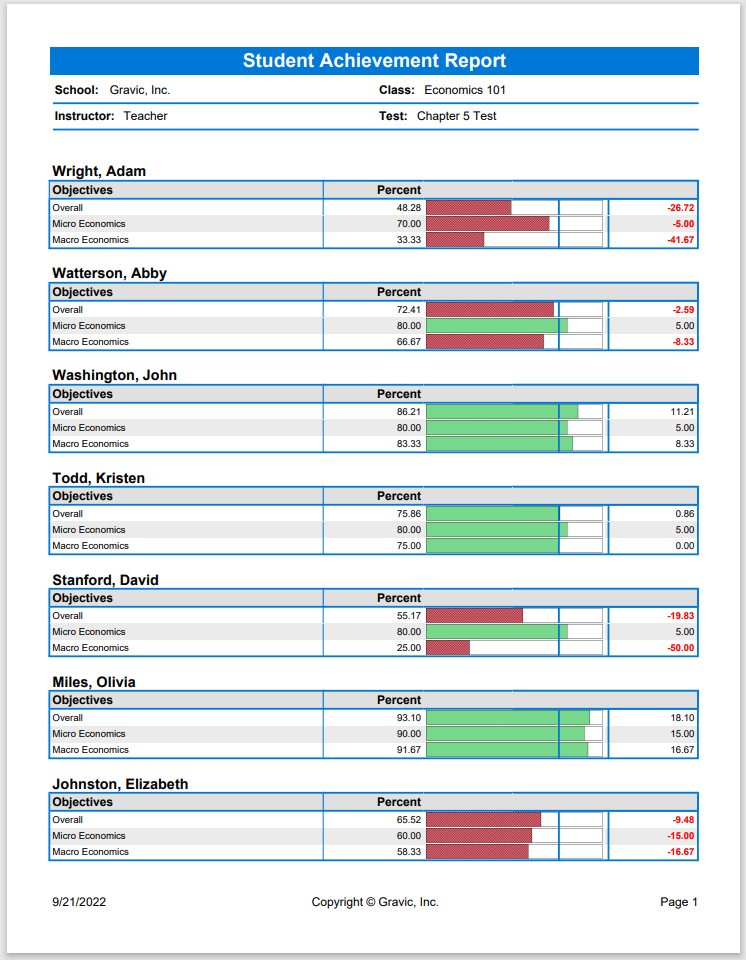
The Student Achievement Report shows how each student performed on the overall test and on any learning objectives. Student scores may be compared against a benchmark value. This report allows you to quickly see who has or has not mastered the subject matter. The report can be emailed to students.
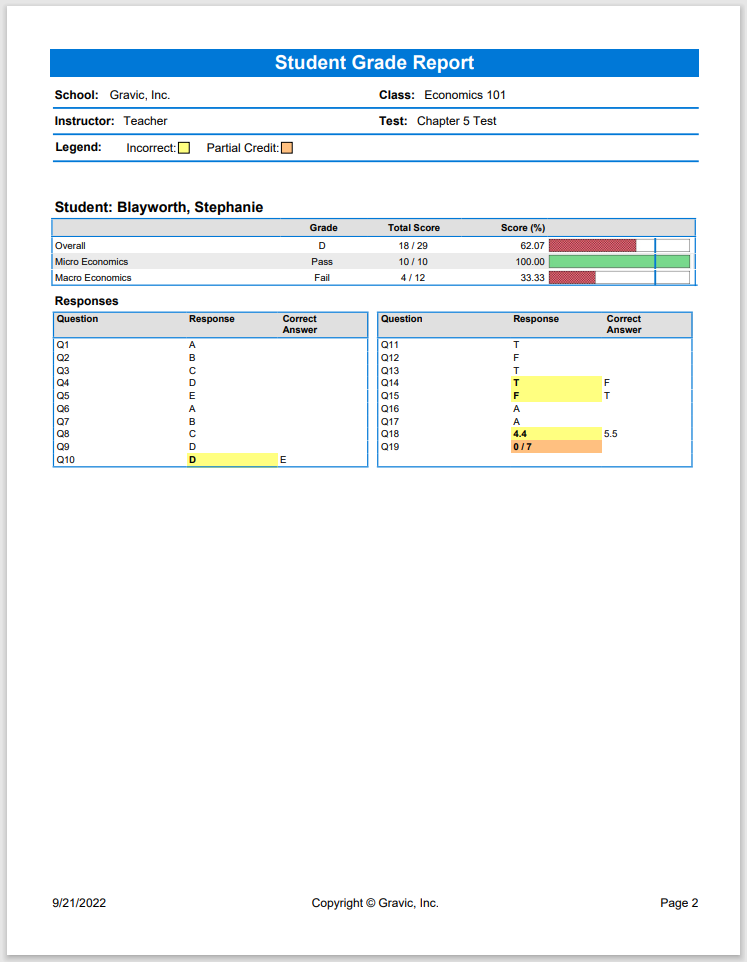
The Student Grade Report provides complete test information for each student that can be handed back to a student, parent, or teacher. If a benchmark score was defined in the answer key it will include a bar chart depicting the student’s score along with the benchmark. If learning objectives were defined it will display the score for each learning objective in addition to the overall test.
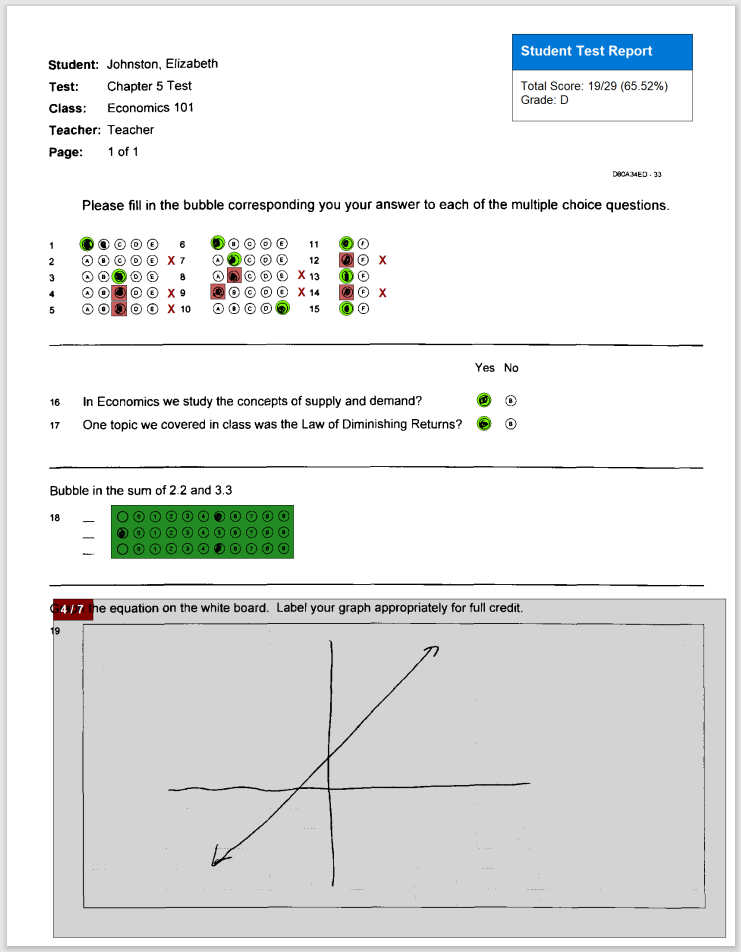
The Student Test Report contains an annotated scanned image of the student’s test form. Annotation includes the grade on the test, the responses (correct or incorrect) for each multiple-choice item, optionally the correct answer, and the points awarded for each open-response item. Any instructor comments will also appear on the report. This report can be emailed to students.
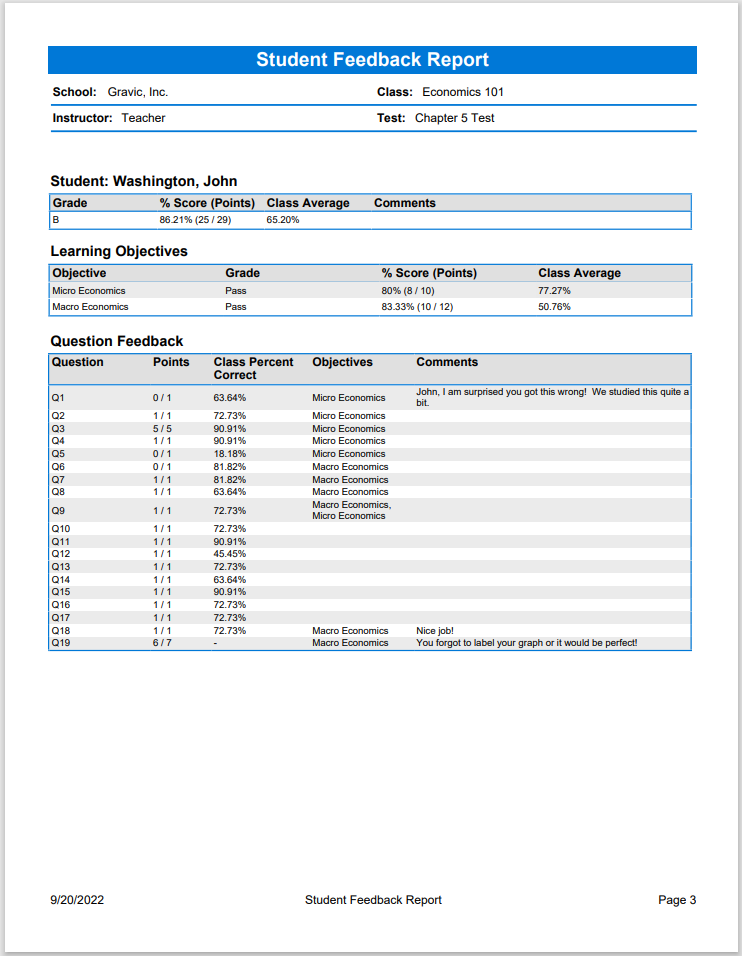
The Student Feedback Report includes grade information for the overall test and any learning objectives on the test, and the student’s answers to selected questions. It also includes any comments made by the grader. This report can be emailed to students.
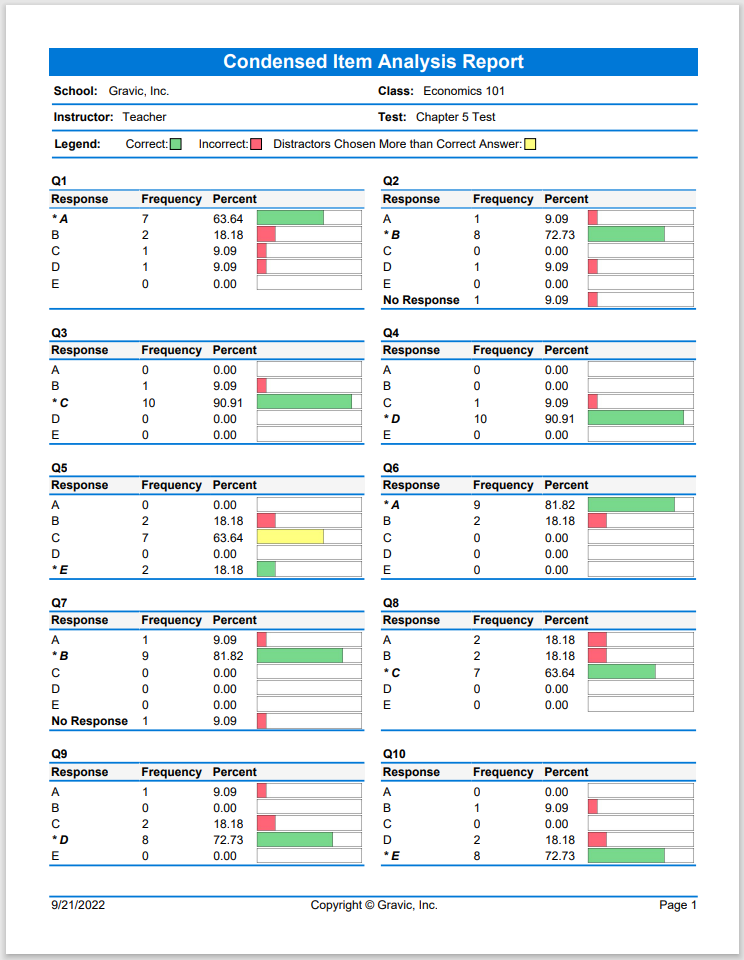
The Condensed Item Analysis Report displays the number of times each possible answer choice was selected, providing a check for question validity. Correct and incorrect options are denoted in the bar chart. Cases where more students picked an incorrect answer than the correct answer are also denoted, which may indicate a problem in the answer key. Any issues can be corrected by editing the answer key and the student data is automatically regraded.
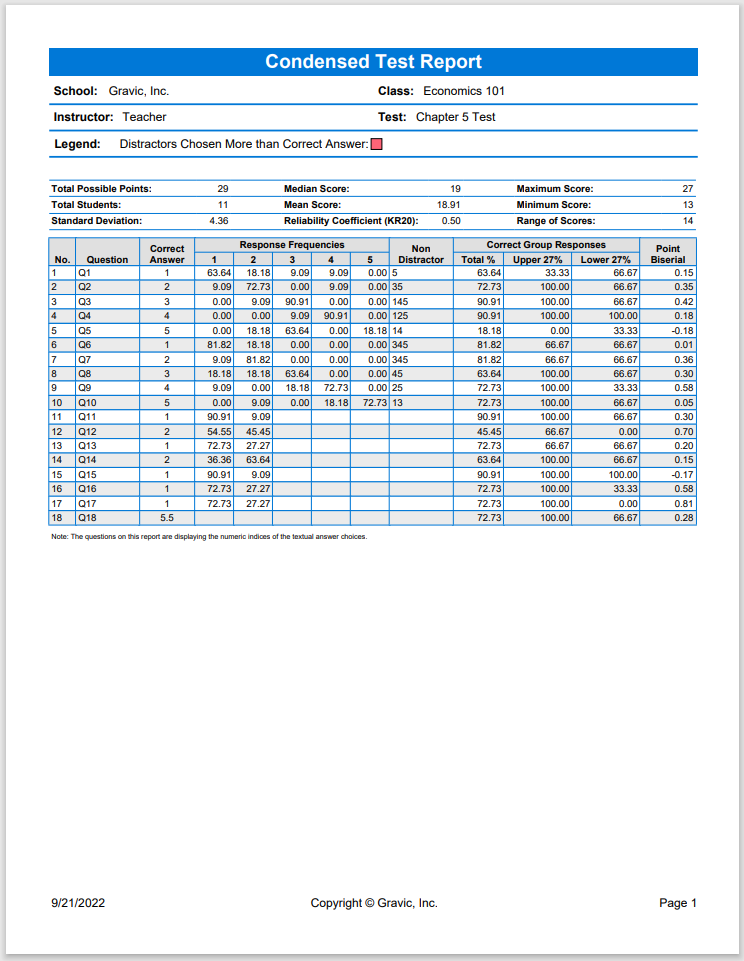
The Condensed Test Report provides answer choice frequency information on a question-by-question basis, including distractor and class score information. This report is a great way to see questions and class performance at a glance.
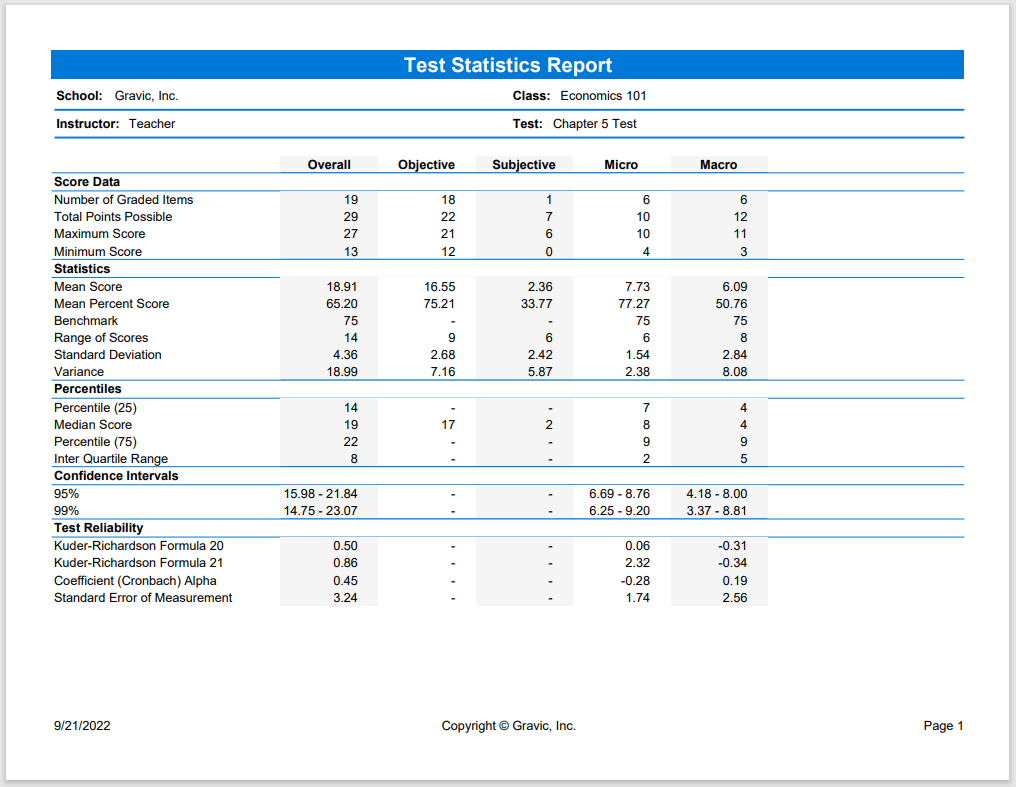
The Test Statistics Report displays statistics for the overall test and learning objectives. Statistics include: possible number of test points, number of graded items, and high and low scores. Statistics: mean, benchmark, range, standard deviation, and variance Percentiles: 25th and 75th percentile, plus interquartile range, and median score Confidence Intervals: 1, 5, 95, and 99% intervals Test Reliability: Kuder-Richardson and Cronbach Alpha statistics.
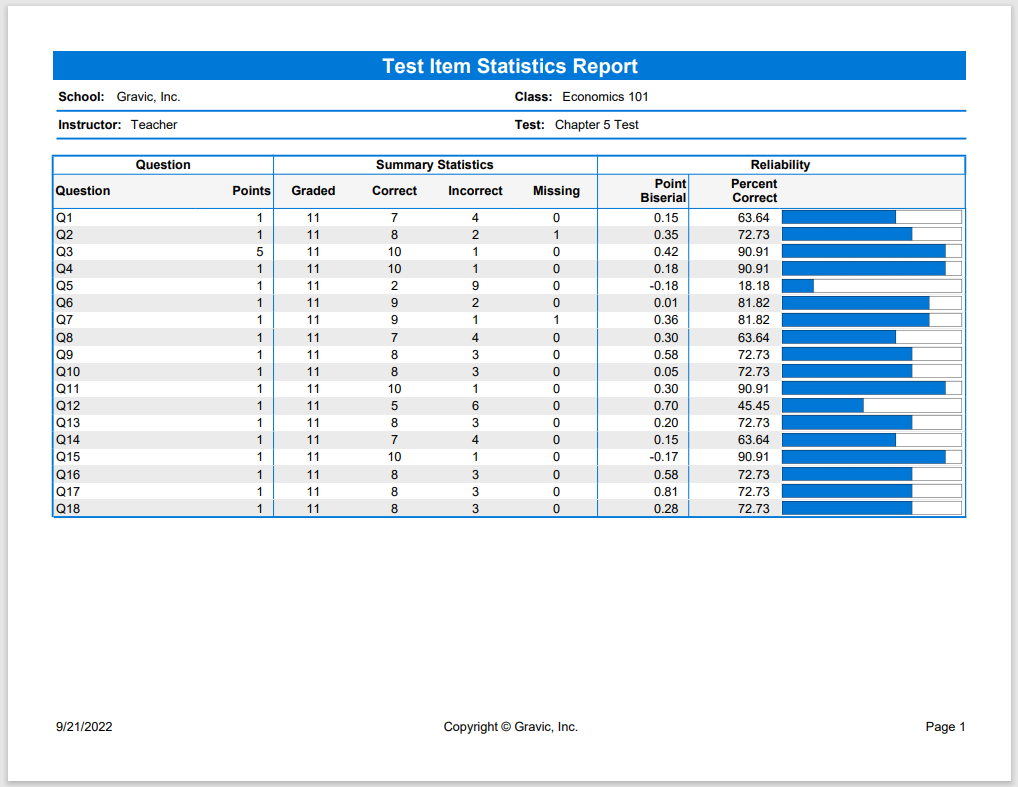
The Test Item Statistics Report displays basic statistics for each question on the test. These statistics include the point value, number of responses that were graded, the number of students that answered it correctly, incorrectly, or did not answer, and the percent of students who answered the question correctly. The point biserial is also calculated. Questions can be sorted by name, percent correct, or point biserial.